While newsrooms provoke fear and anxiety about concocted “crises”, life is better than ever, as Alan Austin reports.
THE SHONKS AND LIARS in the mainstream newsrooms want Australians to believe the economy is struggling – the opposite of the truth.
They know the Coalition’s cost-of-living crisis ended in mid-2023. But that is their only attack line. So they lie. Day in, day out; week in, week out, for three years now.
One mendacious statistic finance “reporters” and their tame economists use routinely is GDP per capita, which the Bureau of Statistics (ABS) calculates quarterly.
The ABS explicitly states that ‘GDP is a measure of production and not a measure of economic welfare’, yet the craven newsrooms insist declining GDP per capita shows falling living standards.
It doesn’t. Academics worldwide, including Dr Ashton Schottler in Germany, describe using GDP per capita to prove anything as “stupidity”.
Much better measures to track affluence are readily available.
We could start with imports of chocolate from Germany, Switzerland and elsewhere, which rise during booms, plateau when times are tough and decline during recessions. We might call this the Ferrero index. See chart below.
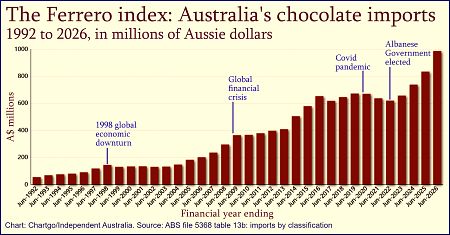
This has hit a fresh record in each of the last three years, soaring 50.1% over that period.
Finding effective alternative measures
Multiple other datasets reflect living standards. History shows the following 40 rise during periods of prosperity, then fall during downturns. They have surged over the last three years.
Consumer spending indicators
1. Household expenditure increased in 2025-26 by 5.3% over the previous year, and by 33% since 2021-22, much higher than inflation. Spending to GDP hit a new record of 34.5% in the June quarter.
2. Retail sales are booming. Empty shops in shopping centres across Australia are now down to 4.4%, the lowest since 2018. Major city centres have tight vacancy rates of 2.8%, while regional centres are lower still at just 2%.
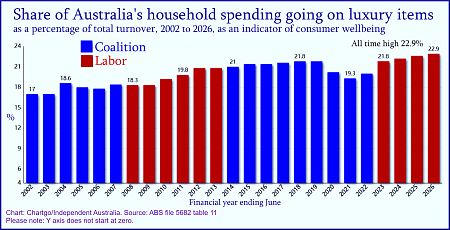
3. Consumer spending on jewellery, cosmetics and other luxuries hit an all-time high of 22.9%. See chart below.
4. Percentage of all retail outlays spent on dining out reached a record 13.8% in the financial year to June.
5. The ratio of luxury consumer spending to GDP was 12.7% in 2025-26, a fraction below the 2023 record.
6. The percentage of students attending fee-paying private schools is at a high of 38.2%, up from 34.9% in 2021.
7. The value of imported Champagne and other beverages topped $2.25 billion in 2026, and continues to rise.
8. Chocolate imported from Europe and elsewhere. See chart above.
9. Overseas flights by Australians soared to a record 12.7 million in 2025-26.
10. Overseas flights per thousand population reached a high of 457 in 2026, up from just 171 in 1999.
11. Spending on domestic tourism hit a record $153.2 billion in 2024–25.
12. Attendances at music performances, plays, ballets and other live shows reached the highest levels ever last year and again this year.
13. AFL matches are on track for a record 8.2 million attendees in 2026. Other sports are also scoring record crowds.
14. Gymnasium membership grew 3.6% in 2025 and is still expanding.
15. More Australians now own expensive exotic pets.
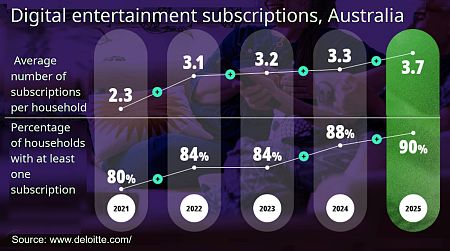
16. Households with subscription video on demand grew to 90% in 2025. See chart below.
17. Horse ownership and enrolments in riding schools have jumped since the cost-of-living crisis ended in 2023.
18. Participation in racehorse syndicates is galloping again.
19. Scuba diving clubs are thriving with the market expanding 8.4% annually.
20. Estimated yacht sales in Australia are a record $175 million this year. These include sporting vessels and more modest trailer boats, so they are not just for millionaires.
21. Sales of electric vehicles reached a record 154,304 to the end of August, up 139.7% on last year.
22. Total new car sales reached 850,401 by 31 August, another all-time high.
23. Recreational flying and flight training are now taking off again.
24. Single-engined light aircraft registrations are at an all-time high of 12,254.
25. Ownership of hot air balloons and gliders has soared to a record 1,422.
Macroeconomic indicators
26. The inflation rate has tumbled from 7.83% in 2022 to 3.45% today, having fallen for the last four months.
27. The minimum wage has risen 30.1% from $772.60 in May 2022 to $1,004.90 now, well ahead of inflation.
28. Real wages, after inflation, have increased 3.6% between June 2023 and June 2026.
29. All pensions and benefits have risen more than inflation since 2022.
30. Quarterly total national factor income is a record $674.6 billion.
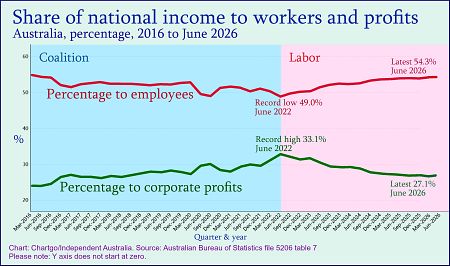
31. The workers’ share of national income is up from 49% in June 2022 to 54.3% in June 2026. See chart below.
32. Jobs created in 2025-26 were 253,680, setting a new record of 14,823,100 employed. The jobless rate has now been below 4.5% for 56 months.
33. Jobs to population have been above 63.5% for a record 52 months.
Household wealth and poverty
34. Average wealth is sixth-highest in the world: US$616,306 (AU$859,500).
35. Median wealth is third-highest in the world: US$210,783 (AU$294,000).
36. Share of the population with assets above US$100,000 (AU$140,000) is second-highest in the world.
37. Household savings are accumulating while spending is also surging. The saving-to-income ratio rose to 6.5% in June, up from 6.4% in March, and just 2% in June 2023.
38. Credit card debt contracted to $27 billion in July 2026, down from $28.5 billion in July 2024 and $ 38 billion in July 2019.
39. Loans on issue for owner-occupiers reached a record $1,764.6 billion in July 2026, up from $1,417.5 billion in July 2022.
40. The number of households in social housing is at an all-time high of 433,432.
The next challenge is to find an accurate measure of living standards over time to replace the discredited GDP per capita formula. Coming soon.
Meanwhile, let’s share another box of Ferrero chocolates while relaxing on the boat after driving to the footy.

Alan Austin is an Independent Australia columnist and freelance journalist. You can follow him on Twitter @alanaustin001 and Bluesky @alanaustin.bsky.social.
 This work is licensed under a Creative Commons Attribution-NonCommercial-NoDerivs 3.0 Australia License
Support independent journalism Subscribe to IA.


Related Articles
- Australia’s incompetent newsrooms fail to report best financial year ever
- Australia’s economic slowdown shows inflation strategy is working
- Merchants of anger, fear and hatred thrive in Australia
- Real wage increases ensure living standards are rising
- Why wealth matters and why Australia is a world leader