The Budget papers reveal an Australian economy in much worse shape than it was under Labor. Alan Austin unpicks the data.
NO-ONE IN THE MAINSTREAM MEDIA is saying this out loud, but the 2016 Budget papers clearly show Australia’s economy is in much worse shape than it was under Labor.
The year 2012-13 was, according to the media and all Coalition spokespersons, disastrous. They all pilloried Labor’s record in growth, jobs, taxation, spending, the deficit quantum, the deficit variation from forecasts and, most notably, the debt.
No slack was cut for the fact that the world was recovering from the worst recession in 80 years. To the mainstream, that was no excuse.
No GFC for the L-NP
So now the Coalition has run it for nearly three years, has the economy improved?
First, let’s be clear that the global situation now is much more benign than it was four years ago. In May 2012, 11 of the 34 rich OECD countries were in recession. And another four were just about to cop one. Today, none.
The Budget papers admit this:
‘The global economy is nevertheless forecast to grow by 3¼ per cent in 2016 and 3½ per cent in 2017.'
OOPS! Libs own budget confirms strong growth under Labor, incl GFC proving "budget emergency" a total LIE #AusPol pic.twitter.com/2Au5h3iEne
— Kiera (@KieraGorden) May 3, 2016
The Coalition’s most repeated assertion is that they are
“... balancing the budget, reducing the deficit and debt [and] getting the unsustainable spending growth trajectory which we inherited from Labor under control."
Yesterday’s documents prove they are doing the opposite.
Deficits
Labor delivered five budgets, excluding the transition years. The average of those deficits – 2008-09 through to 2012-13 – is $38.36 billion. That period included the global financial crisis (GFC). In Labor’s last full year, the deficit was down to $18.8 billion, having fallen three years in a row. It was projected to fall further.
The Coalition has delivered three budgets, not counting election year 2013-14. The average deficit – assuming the 2016-17 projection is met – is $38.30 billion. If we include the election year, which the Coalition managed for all but the first two months, the average deficit over four years is actually $40.85 billion.
The Coalition has not improved on Labor, despite more favourable conditions.
‘It’s deficits as far as the eye can see’ https://t.co/Tj6dllCXY6
— news.com.au (@newscomauHQ) May 3, 2016
Accuracy of projections
The Coalition continually taunted Labor Treasurer Wayne Swan over his inaccurate forecasts. Again, the Coalition is no better. In 2014-15, Joe Hockey forecast a deficit of $29.8 billion. He delivered a deficit of $37.9 billion — out by $8.1 billion.
Forward estimates have been just as dodgy. In 2014, Hockey projected the deficit for 2017-18 at $2.8 billion. A year later, he revised that to $14.4 billion. Yesterday, Treasurer Scott Morrison put it at $26.1 billion.
Spending
Morrison claims Australia has a spending problem, not a revenue problem. He has both. Contrary to his rhetoric, he is now increasing spending substantially. Up $19.1 billion this year, $14.2 billion next year and a whopping $24.5 billion the year after.
He does not have to do this. Expenditure can be cut. Wayne Swan did so in 2012-13. It should be done now.
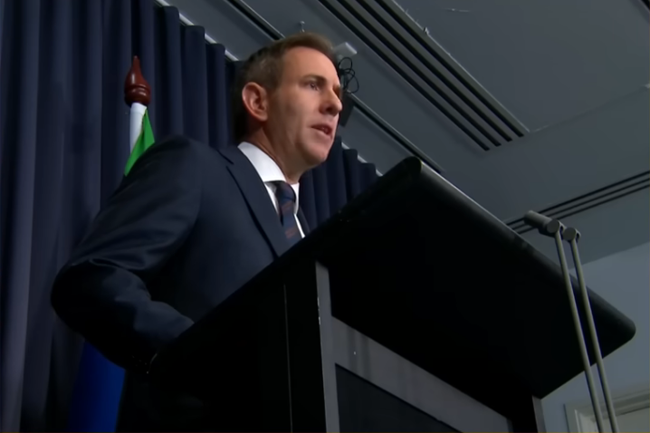
Treasurer Scott Morrison fronts 730 Report to answer questions on #Budget2016 https://t.co/WK4m3AKVVZ
— ABC News (@abcnews) May 3, 2016
Debt
Under Labor, net debt appeared to have peaked in 2013 at around $175 billion. In September 2013, as Labor handed over the books, it was $174.6 billion and set to fall — which it did in the next two months.
Then the Coalition abolished the debt ceiling and began an unprecedented borrowing splurge. They added a staggering $61.4 billion in calendar 2014 and another $35 billion in 2015.
Yesterday’s documents show next financial year’s extra debt will be $40.3 billion, with $20.8 billion more the year after. Some time soon, the debt – which was said to be “spiralling out of control” under Labor – will have doubled.
Taxation
Last week’s tax history data from the Australian Bureau of Statistics (ABS), together with yesterday’s tax projections, reveal the percentage increase year on year. This confirms the concern of Treasury head John Fraser and others that the Coalition has a serious revenue problem.
During the GFC, total tax collected actually fell for two years. It then increased by 8.0% in 2010-11, by another 9.8% the following year and by 6.6% the year after. These revenue rises kept the deficits within reason and the debt down, while vast infrastructure spending stimulated the economy.
In contrast to its fiscal rectitude rhetoric, in its first year (2013-14), the Coalition dramatically reduced its collection of company tax, so the total take only increased 4.0%. In the following year, after Joe Hockey’s first failed budget, tax collected from the top end virtually stopped and total tax revenue rose a paltry 1.2%. It was the same story in Hockey’s second failed budget, the next year, with tax take up just 2.0%.
Scott Morrison's budget is unusual – but not for the reason he thinks it is | Lenore Taylor https://t.co/gUtNntXXbe
— Bear (@1306Chomley) May 4, 2016
Scott Morrison yesterday went for a modest rise in total taxes of 5.0%. We will see if he actually collects it.
In the out years, he appears bolder, with rises of 7.2% and 7.0% projected. This helps him show the deficit reducing.
If he has the courage to raise taxes by seven per cent in the future, then why not now?
Company tax
The dramatic drop in company tax collections will continue, despite strong growth predicted in the economy overall and, presumably, company profits.
This is budgeted at just $69,000 for 2016-17. That is a few dollars higher than in 2011-12, at the end of the GFC, but well below that collected in 2012-13 and 2013-14. Still, at least they are open about allowing corporations to avoid tax.
Jobs
The workforce has changed recently with a strong shift away from full-time workers to part-timers and casuals. This is proven by the ABS numbers of part-timers and hours worked per person. This means the unemployment rate in 2016 does not measure the same level of paid hours the economy is generating as in 2012.
The March data show 5.7% jobless and 83.83 hours worked per month per adult. The previous time only 83.83 hours were worked was in November 2014. The jobless rate then was 6.3%.
Rough algebra indicates that for the economy to produce the same amount of paid work next year as four years ago, the jobless rate should be about 4.6%. The budget papers predict 5.5% — the equivalent in person hours of about 6.7% in 2012.
"Imitation is the sincerest form of flattery." @BillShortenMP talks @ScottMorrisonMP stealing Labor policy. #9Today https://t.co/8jYtexWNIr
— The Today Show (@TheTodayShow) May 3, 2016
Conclusion
There is no evidence in the Budget data to show that any significant area of the economy is now being better managed than during the previous regime.
Bring on the double dissolution.
You can follow Alan Austin on Twitter @AlanTheAmazing.

This work is licensed under a Creative Commons Attribution-NonCommercial-NoDerivs 3.0 Australia License
Turnbull's solution to unaffordable housing: "Shell out" for your kids if they're locked out of the property market. pic.twitter.com/DewSoqBLBA
— Dave Donovan (@davrosz) May 4, 2016
Monthly Donation
Single Donation
Have you seen this Budget Emergency. It used to be belong to the Liberal Party but they kicked it out in 2013. pic.twitter.com/7eYpsUnGur
— Dave Donovan (@davrosz) May 4, 2016
Investigate Australia. Subscribe to IA for just $5.