The latest AFR Rich List charts Australia's wealthiest and illustrates why we have one of the fastest growing inequality rates in the world, writes John Passant.
IT'S A BIT RICH, isn’t it?
Well, it’s more than a bit rich — it’s a lot rich.
Every year the Australian Financial Review's (AFR) 'Rich List' tells us about the extraordinary wealth of the "top" 200 people in Australia. It gives us valuable information about Australian capitalism and trends over time in wealth allocation between the capitalist and working classes.
In 1989, there was one billionaire. In 2002, it reached ten. There were 29 in 2010. Today, it is 76. In 2017, the wealth of the richest 200 grew by about $50 billion or 21% to $282.7 billion. This 21% growth is ten times the growth of wages.
This graph from the AFR shows the growth in wealth of the top 200 since the list began in 1989. It has grown more than tenfold in 2017 dollar terms:
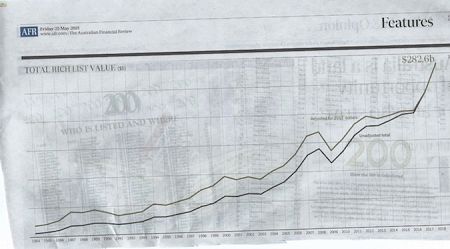
(Screenshot via AFR, Friday, 25 May 2018)
By contrast, between 1989 and 2016 average weekly wages have grown threefold, or thereabouts, over the same period of time.
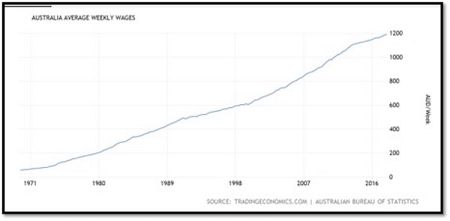
(Source: Trading Economics)
Now, I know that wages are not wealth. However, their growth can be an indicator of the ability of workers to accumulate a little bit of wealth.
For most workers, their major asset will be their home, if they own one. House prices have grown markedly since 1989. The consequence of this for an earlier generation of working-class homeowners is increased notional wealth, but for the next generation, it is an inability for a large number to enter the housing market. Current market price "flattening" indicates the older generation may be in for a shock when, or if, housing prices fall.
Not only that but the 'slower growth in wages’, as the Australian Bureau of Statistics defines the current and ongoing falling real wages period, coupled with cuts in social welfare, means that
‘...the household saving ratio was at its lowest point (4.6%) in nine years in 2016-17.'
So, people are saving less and housing prices in some major cities are beyond working people.
The key to understanding the neoliberal era we entered in 1983 with the election of the Hawke Labor Government and its philosophy of class collaboration has been a massive shift in wealth from labour to capital.
The following graphs from the Australian Bureau of Statistics give a good sense of what has been happening:

The profits share of total factor income has risen over the period 1984 to 2017 from 22% to 27%.

The wages share has fallen from 57% to 53%.
Saul Eslake in The Conversation has helpfully put the trends since 1960 into one graph for us to see the long-term results:

Eslake’s graph shows that the decline in labour’s share began at the very time the Hawke Government came to power and implemented, with the collaboration of trade union bureaucracy, the "what's good for the bosses is good for employees" Accord.
The mantra about growing the pie is really about growing the pie for the bosses, at workers’ expense. And don’t listen to the crowd who parrot the line that increasing productivity will increase wages, let alone wage share.
As Greg Jericho and Gareth Hutchens point out:
‘Since the GFC, productivity has grown well ahead of real wages.'
Their graph shows it clearly:
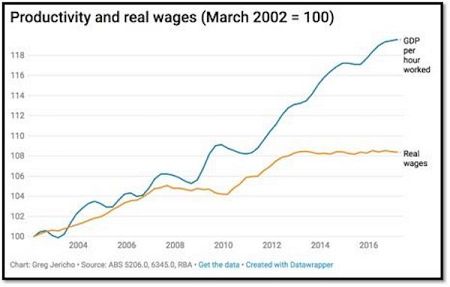
(Source: The Guardian)
This process of wealth transfer from labour to capital involves other aspects too, such as attacks on social welfare, public health and education spending, and other areas of social reproduction. One point of social welfare cuts is to put downward pressure on wages to supposedly increase profits. However, falling or stagnating pay for workers doesn’t improve consumer activity. As the unemployed become more desperate trying to survive on welfare allowances more than $150 below the poverty line, the philosophy is that this will see them accept lower wages to get a job.
It is the same trickledown nonsense with the company tax cuts. More pie in the form of less tax for them, however, does not lead to more pie for us. So, too, the Turnbull Government’s big tax cut plans for people earning over $200,000.
In selling its '2018 Rich List' edition, AFR's editorial proclaimed: ‘Australia is a land of opportunity for all who strive.'
This, too, is nonsense. It suggests those who are unemployed choose not to work.
Hard work won’t solve the unemployment issue. There are about seven unemployed workers for each job advertised. According to the Australian Unemployed Workers Union, if we include the underemployed and hidden unemployed, the figure is more like 17 to one.
Around 3 million Australians live in poverty, including over 731,000 kids. As for pensioners, one-third live below the poverty line. Homelessness has increased by over 14% between 2011 and 2016. There are now over 116,000 people who are homeless.
Workers’ wages are going backwards. The hard work of 10 million workers merely ends up making profits for the bosses. The rich get richer and the poor and workers are getting poorer. This is current Government policy to ensure "adequate" profits for business. The growth of wealth of the Rich List 200 by $50 billion (21%) last year, is but one example of the ever-increasing inequality that is Australia. According to the IMF, Australia has one of the fastest growing inequality rates in the world.
What else can the 'Rich List' tell us? Of the 200, there were just 19 women on the list. The average age is 66. Some things stay the same. However, the 'List' is becoming more global.
As the AFR says:
‘A quarter of the list's 76 billionaires now live abroad, up from one out of 37 a decade ago.’
Rough calculations suggest over a third of those on the list, including Packer, two Rineharts (Gina and Bianca) and the soon to be super-rich Lowy children, inherited their wealth.
The top five industries for the 'Rich List', according to George Tchetvertakov in Small Caps, were: ‘property (51 people), retail (22), investment (20), resources (18) and financial services (16).’
This suggests a society overly dependent on property development.
With all this extreme wealth in a society of gross inequality, poverty and flatlining wages, what can be done?
Below is one last graph which I think sums up how we got to this rotten state of affairs and suggests a way to address it.
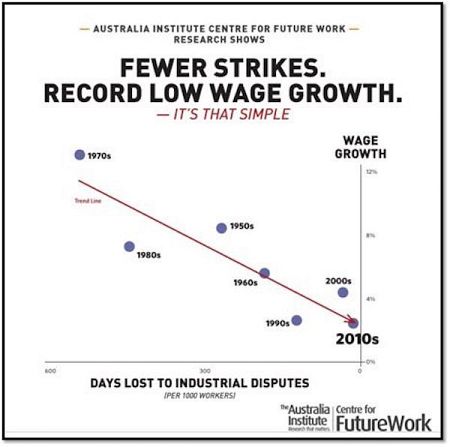
To put it another way, as Jim Stanford at the Centre for Future Work Centre says:
‘The relative frequency of industrial action (measured by days lost in disputes per 1,000 workers employed) declined 97% from the 1970s to the present decade.’
Changing the rules won’t change that. Breaking the bosses' rules will.
It is time for workers to reclaim their unions, and to strike for big wage increases and a fair and just society. That and that alone will wipe the smile off the faces of the rich-listers, and begin the process of redistributing the wealth back to those who create it — workers.
Read more by John Passant on his website En Passant or follow him on Twitter @JohnPassant. Signed copies of John's first book of poetry, Songs for the Band Unformed (Ginninderra Press 2016), are available for purchase from the IA store HERE.
 This work is licensed under a Creative Commons Attribution-NonCommercial-NoDerivs 3.0 Australia License
Support independent journalism Subscribe to IA.